 |
||
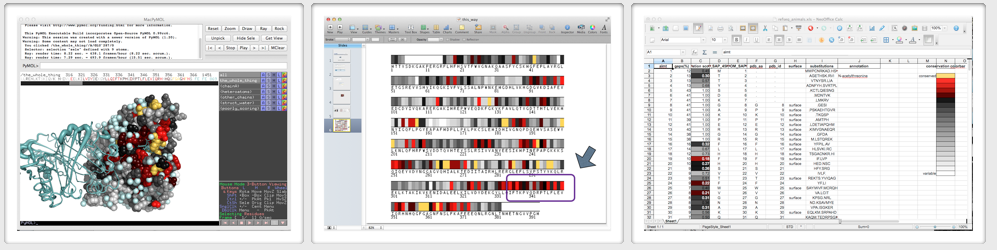
| Produce a 3D conservation map for import into Pymol ... |
... 1D conservation map in png format, suitable for import and further annotation in your favorite presentation software ... | ... and a spreadsheet to which you can add your own annotation. |
Click here to see a sample results page.
These are tools for planing your experiment. These are tools for interpretation of variants, seen in healthy people, and disease-related.
Check out the conserved regions on the surface: Typically they indicate a position where a small ligand (metabolite, or signaling molecule or metal ion) binds. Larger areas, still better conserved then the rest, perhaps indicate interaction with other proteins.
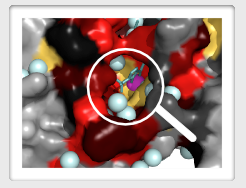
Check out the conserved cluster of residues deep inside a globular domain. This is the "folding core" of the domain. A mutation in that region may cause domain misfolding. Cells will typically get rid of such proteins through ubiquitin-proteasome system.
If the structure is not known, or if the protein is disordered, we have to work with the 1D information alone. A bit more difficult, but still doable. Collect in the spreadsheet the data from all sources that you have available - including your own previous work. Put it all together in a slide, against the backdrop of the conservation map, and use for discussion with your geek friends. Are there any regions of conservation to which no purpose or function has been ascribed so far?
If you are looking to manipulate novel phenotype, place your mutations in these regions. Use the conserved patches to guide the docking, or predict the impact of naturally occurring mutations by the degree of conservation of the region they fall into. If you are trying to understand the impact of a variant - these are the regions which may cause dysfunction.