
|
|
| Xls spreadsheet |
| Pymol session (zipped) |
| Pymol script (pml) |
| The complete workdir (zipped) |
|
|

|
|
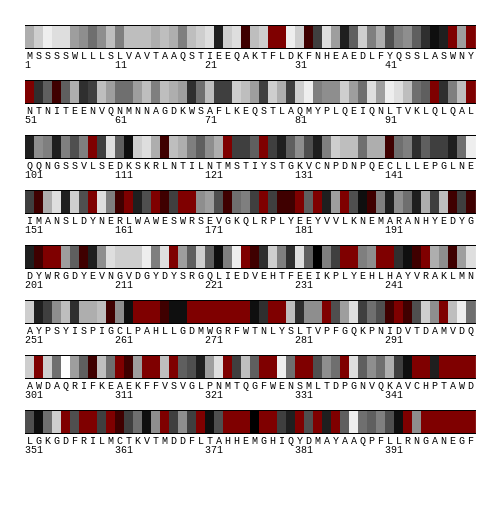
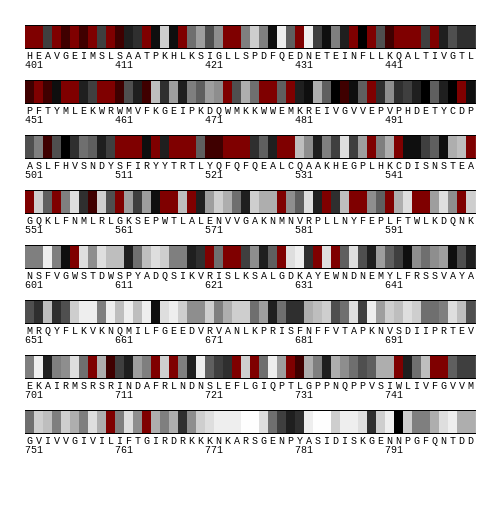
The residues are ranked according to the conservation score, and binned into 5% bins. The bins are colored according to the legend. Note that if 30% or more positions are conserved, the topmost bins will be empty, and the resulting map will be black-and-white. Blue bars, when present, indicate exon boundaries. |


|